Single Channel Infrared Photometry with a Small
Telescope
WestSkies Observatory, Mulvane, Kansas, USA
Invited
Talk.
Introduction
The recent development of the SSP-4 Infrared Photometer
has opened a new window for the small telescope observer, that is, light with
wavelengths beyond one micron. Up until
now, the infrared wavelengths were strictly the domain of the professional
astronomer and large telescopes. The
SSP-4 photometer allows an amateur or professional with a small telescope to
precisely measure starlight in the J (1.25 micron) and H (1.65 micron)
bands. This paper presents a brief
overview of the development, design, and error estimates for the SSP-4. Initial
observations and status of the Infrared Photometry Group of the American
Association of Variable Star Observers (AAVSO) are also covered.
SSP-4 Photometer Development and
Design
The development of the SSP-4 was a joint effort between
the AAVSO and Optec, Inc., the designer and manufacturer of the
instrument. The AAVSO has taken deliver
of the first five instruments and the observer team is lead by the author. The
AAVSO members that were most actively involved with Optec in the development of
the photometer were: Janet Matti, Arne Henden, Bob Wing, and Doug West.
The SSP-4 is very similar in external design to the
venerable SSP-3. However, some of the
internal electronic components are very different. The most obvious difference is the detector, the SSP-4 uses an
Hamamatsu G5851 InGaAs PIN photodiode, where as the SSP-3 uses a silicon
photodiode. The InGaAs detector is thermoelectrically cooled to -40C within the
SSP-4. Figure 1 is the photosensitivity curve as function of wavelength for the
detector. The peak response of the
detector is approximately 1.75 micron.
More technical information about the SSP-4 can be found on the Optec,
Incorporated web site
www.optecinc.com .
Figure 1 Spectral Response of the InGaAs Detector
The outline of the SSP-4 photometer is shown in figure
2. The operation of the photometer is
straightforward and the user interface is intuitive. A flip mirror and
alignment eyepiece are used to center the starlight onto the detector.
Figure 2 Outline of SSP-4
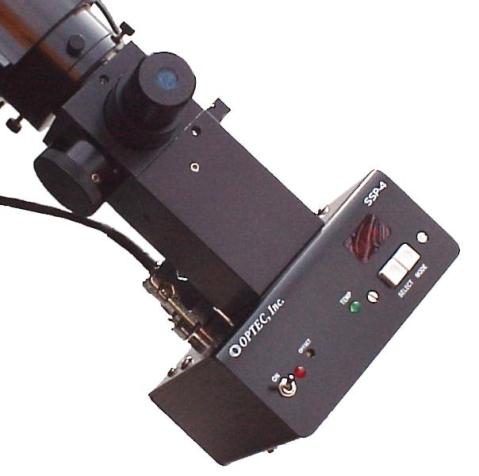
Figure 3 Picture of SSP-4
The control panel for the SSP-4 is shown in figure 3. The gain, detector temperature, and
integration time are set through a menu system that appears in the red led
window. Once the operating parameters
have been input, that is, gain, integration time, and detector temperature,
then the counts are read from the red led window. A computer can be interfaced to the SSP-4 for data
collection. A software package for
computer control is supplied with the photometer. Not completely shown in the picture is the manual slider for the
J and H band filters.
Filter system
for the SSP-4
The J and H band
filters for the SSP-4 are built to the Mauna Kea Observatories (MKO) system
(Simons and Tokunaga). The bandpasses of the two filters are slightly narrower
than previous filters to avoid contamination by water vapor in the
atmosphere. This filter system
represents a compromise between the competing factors of throughput and
photometric performance and has been endorsed by a working group of the
International Astronomical Union. In a
paper by Arne Henden (Henden 2003), a good presentation is given on the history
and development infrared filters.
Figures 4 and 5 show the MKO bandpasses and the atmospheric transmission
for the two filters.
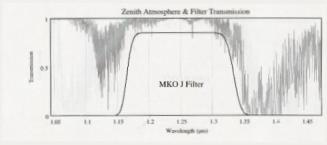
Figure 4 MKO J Band Filter Curve
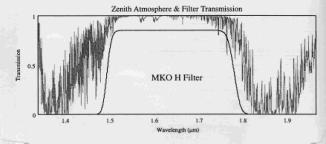
Figure 5 MKO H Band Filter Curve
Estimation of the Error
This section develops the relationship between the
signal-to-noise ratio (SNR) and the error in magnitude for a single five second
integration with the SSP-4. As with any
scientific instrument it is necessary to understand the limitations and errors
of measurement. The SNR is calculated from the ratio (average counts for n
measurements)/(standard deviation for n measurements). Note that the standard deviation is for a
single measurement and not for the mean.
Seven or eight five second integrations per band were taken for each
star. The sky background count was an average of three five second
integrations. The telescope used was a
Meade LX200 0.2m SCT and the observing setting was suburban. At the observing location in Mulvane,
Kansas, USA, the typical naked eye visual limiting magnitude is 4.5.
In table 1, the columns labeled “J Band SNR” and “H Band
SNR” represents the average SNR that would be expected for stars with
magnitudes between –2 and 4. These
numbers are derived from an exponential curve fit. The columns with labels “J Band Error” and “H Band Error”
represent the expected error (one sigma) associated with each value of
SNR. The formula for calculation of the
estimated error is 1.0857/SNR.
Table 1 – Estimated SNR and Error as a Function of
Magnitude
|
|
J Band |
J Band |
H Band |
H Band |
|
Mag |
SNR |
Error |
SNR |
Error |
|
-2 |
456 |
0.00 |
196 |
0.01 |
|
-1 |
255 |
0.00 |
148 |
0.01 |
|
0 |
143 |
0.01 |
111 |
0.01 |
|
0.5 |
107 |
0.01 |
96 |
0.01 |
|
1 |
80 |
0.01 |
84 |
0.01 |
|
1.5 |
60 |
0.02 |
72 |
0.01 |
|
2 |
45 |
0.02 |
63 |
0.02 |
|
2.5 |
33 |
0.03 |
55 |
0.02 |
|
3 |
25 |
0.04 |
47 |
0.02 |
|
3.5 |
19 |
0.06 |
41 |
0.03 |
|
4 |
14 |
0.08 |
36 |
0.03 |
Initial Observations with the SSP-4
Initial observations with the SSP-4 and a 0.25 SCT through
17 June 2003 are presented. The
observation technique was as follows:
1.
Set gain =10, Detector temperature = -40 C, and
integration time = 5 seconds. Set dark current greater than 100.
2.
Eight observations with J filter of star
3.
Three observations of sky with J filter
4.
Eight observations with H filter of star
5.
Three observations of the sky with H filter.
6.
Next star and repeat steps 2-5.
In a
typical observation session, each star is measured at least twice in each
filter band. Each observation has been reduced with the Henden and Kaitchuck Astronomical
Photometry Software For IBM-PC (http://www.willbell.com/). This software takes into account color
differences between the comparison stars and airmass differences. The average
airmass extinction coefficients and color transformation coefficients were
calculated over four nights using Henden standard stars and stars from the
UKIRT list. Additional information about how the color transformation and
airmass extinction coefficients were determined can be found at http://www.aavso.org/observing/programs/pep/report3.shtml
.
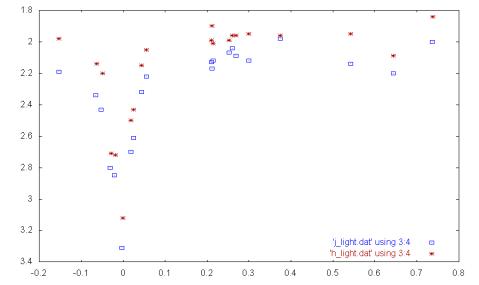
Table 2 contains initial observations with the photometer.
Table 3 gives the magnitudes of the comparison stars used in the reduction of
the observations. Each of the column headings is self explanatory except for
the “Est Error” column. The error was
estimated by taking the standard deviation of the mean. Taking at least two observations per target and
using two comparison stars results in at least four estimates of the target magnitude. The standard deviation of the mean of these
multiple observations becomes the estimated error. All of the observations in
table 2 have been submitted to the AAVSO or Association of Lunar &
Planetary Observers (ALPO).